Building a Carbon Emissions Calculator: When Your Product Name Becomes Your Destiny
How inbound SEO traffic, customer demand, and the GHG Protocol rabbit hole led us to build our most-used feature

Welcome to what I’m calling my “ESG Product Confessionals” – a series where I’ll share the unfiltered truth about building ESG products that people actually use (and occasionally, love).
We’re kicking things off with the big one: our Carbon Emissions Calculator.
Not because it was our first rodeo, but because it taught us everything we know about building in the sustainability tech space.
Spoiler alert: It involved more Excel sheets than I care to admit, countless debates about Scope 3 boundaries, and at least one existential crisis about emission factors.
The “Why” Behind the Calculator: Following the Market Signals
Here’s how it started: Every. Single. Customer. Demo. Would inevitably reach that moment.
You know the one.
After discussing their ESG strategy, sustainability goals, and regulatory pressures, they’d lean in and ask:
“So... can you help us calculate our carbon footprint?”
Initially, we thought we were building an ESG management platform. Turns out, we were building a GHG emissions calculator with extra steps.
The Market Couldn’t Have Been Clearer
The signals were impossible to ignore:
Since we had ‘Carbon’ in our product name, the SEO analytics showed that “GHG emissions calculator” was driving more organic traffic than any other keyword
We were appearing on Google’s first SERP for emissions-related queries even before we had a fully-fledged product
Every prospect discovery call included the question: “Can your tool calculate our emissions?”
Customers were literally searching for us by name + “carbon calculator”
Classic cart-before-the-horse situation, but hey, we’re not complaining!
The demand was crystal clear: Companies needed a tool that could transform their messy operational data into clean, auditable carbon footprints. Preferably yesterday! Yeah, you read that right! Definitely before their next board meeting.
From Zero to Carbon Calculator: The Build Journey
Phase 1: Research (aka Down the Rabbit Hole)
We started where all sensible product teams start – by stalking our competitors. I mean, conducting competitive research. Hehe!
What we analyzed:
Free online calculators (napkin math at best)
Enterprise platforms (required a PhD to operate, LOL)
Industry-specific tools (great for manufacturing, useless for everyone else)
Consulting firm spreadsheets (surprisingly sophisticated, surprisingly broken)
Then came the fun part: diving into the GHG Protocol.
I like to call GHG Protocol the ‘Holy Bible’ for carbon emission calculations! If you’ve never had the pleasure of reading GHG protocol, imagine reading tax code but for carbon. It’s comprehensive, it’s rigorous, and it will make you question every life choice that led you to page 47 of Scope 3 Category 11 guidance. I wish back then we had NotebookLM, it could have saved so much time for the research!
Then, it was time to collect emission factors.
We built our emission factors repository by pulling from:
EPA databases
DEFRA factors (UK)
GHG Protocol defaults
Regional databases (EU, APAC, etc.)
Industry-specific sources
Pro tip: Emission factors are like time zones. Just when you think you understand them, you discover there’s a weird exception that breaks everything.
Phase 2: Prototype & Reality Check
Our first prototype was beautifully over-engineered.
I imagined users would lovingly input data into our elegant interface, carefully categorize every transaction, and rejoice in the accuracy of our calculations.
Reality check: They wanted to upload an Excel file and get answers. Immediately.
What stakeholder engagement taught us:
Sustainability managers were already drowning in data
They didn’t need another platform to learn
They needed something that spoke their language
Most importantly: They needed something that integrated with their existing chaos
So we pivoted hard. We built:
✅ Import templates that actually made sense
✅ Bulk upload capabilities with smart validation
✅ Forgiving data mapping (because real data is always messy)
✅ Clear error messages (revolutionary, I know)
Because real data is always messy, and anyone who tells you otherwise is selling something else or haven’t dealt with the client’s data yet.
Phase 3: GTM & Launch (The Validation)
Our go-to-market was refreshingly straightforward:
We had inbound demand ✓
We had Google rankings ✓
We had a tool that actually worked ✓
We launched with existing customers who’d been waiting for this feature, gathered feedback, and iterated fast.
The first time a customer calculated their full organizational carbon footprint using our tool – complete with all three scopes – and said, “This actually makes sense,” I was filled with joy!
Don’t judge me.
The AI Revolution: Making Things Actually Smart
This is where things got interesting. We’d built a functional calculator, but AI opened doors we didn’t even know existed.
Document Parsing: OCR Magic
Remember how I said users wanted to upload Excel files?
Well, they also had:
Invoices (in PDF)
Utility bills (sometimes photos from phones)
Receipts (various formats)
Scanned faxes (yes, in 2024, faxes still exist)
What we built: OCR-powered document parsing that could extract data from invoices and bills automatically.
What it does:
Reads energy consumption from utility bills
Identifies fuel purchases from receipts
Extracts supplier information
Populates our calculation engine without manual data entry
When it worked, it felt like magic.
When it didn’t (looking at you, 1990s-era invoice formats), it felt like teaching a robot to read cursive.
Automated Emission Factor Mapping
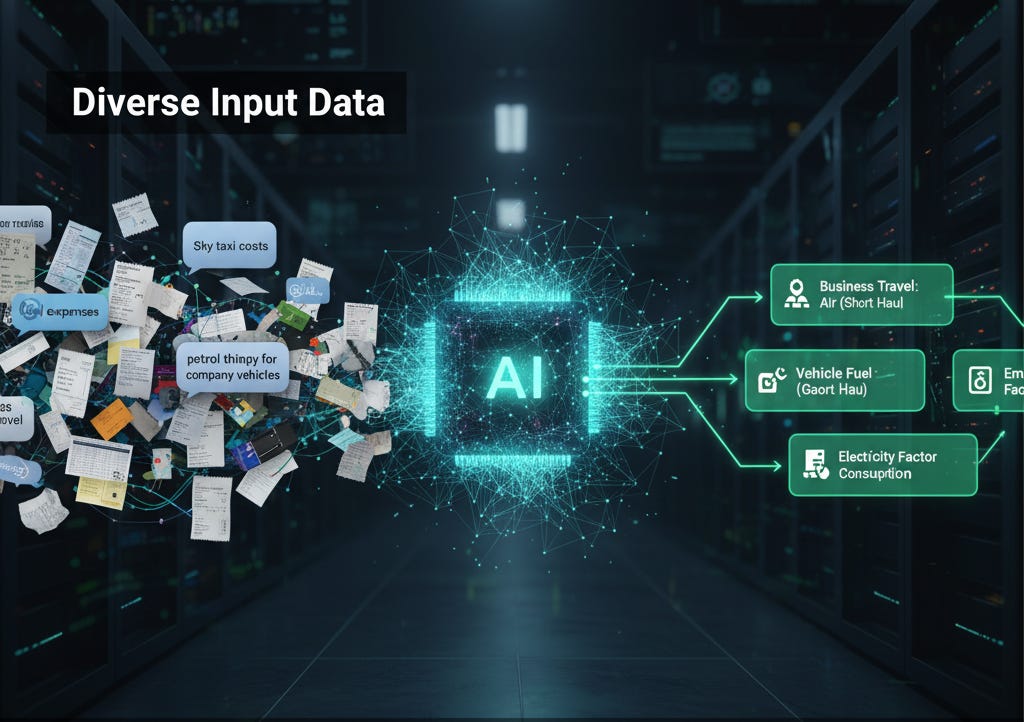
Here’s a problem we didn’t expect: users described the same activity in a thousand different ways.
These all meant “business travel”:
“Business travel”
“Flight expenses”
“Air travel”
“Aviation”
“Sky taxi costs” (my personal favorite)
“Employee flights”
“Corporate air travel”
The solution: We built an AI model that could map user activity descriptions to the appropriate emission factors automatically.
It learned from corrections, understood context, and eventually became eerily good at guessing what “petrol thingy for company vehicles” meant.
Impact: This single feature probably saved our users hundreds of hours of manual categorization. It also saved our support team from an existential crisis.
The Challenges: Where We Learned Humility
Challenge #1: Financed Emissions (The Final Boss)
Building data models for financed emissions (Scope 3 Category 15, for the nerds) was like playing chess in four dimensions.
The complexity:
You’re calculating the emissions of your investments
Which depend on the emissions of portfolio companies
Which themselves have Scope 3 emissions
And suddenly you’re three levels deep in an inception-style emissions calculation
What we had to build:
Flexible data models handling different calculation methodologies
PCAF standards compliance
Attribution factors by asset class
Data quality scoring frameworks
All while keeping the interface simple enough for finance teams
It took three architecture iterations and more whiteboarding sessions than I can count.
Challenge #2: Supplier Data (The Black Hole)
Let’s talk about the elephant in the room: supplier data.
Tier 1 suppliers: Manageable. They have some data, some sustainability reporting, and respond to emails occasionally.
Tier 2 and 3 suppliers: Welcome to the wild west.
Most don’t track emissions
Many don’t respond to surveys
Some don’t even know what Scope 1 means
A few think “carbon footprint” is a shoe measurement
What we did:
Built estimation models based on spend
Created industry average databases
Developed spend-based calculation methods
Built supplier engagement workflows
The bigger realization: This problem revealed a massive gap in the market. Companies needed a way to actually engage with and assess their suppliers on sustainability metrics.
This challenge eventually gave birth to our Supplier Assessment module. (More on that in a future post.)
Challenge #3: AI Promises vs. Reality
The biggest lesson? AI features are easy to commit to in product roadmaps and incredibly difficult to ship well.
Our AI ambitions vs. reality:
What We Promised
What We Learned
AI that automatically categorizes everything
Needed extensive training data and constant refinement
Predictive emissions modeling
Required too much company-specific context to be accurate
Automatic reduction recommendations
Users wanted specifics, not generic suggestions
Smart data quality scoring
Worked, but needed clear explainability
Our framework for AI feature decisions:
Does this AI feature:
Save significant time? (>30% reduction in manual work)
Improve accuracy? (Better than human baseline)
Fail gracefully? (Clear when it’s uncertain)
If the answer to all three wasn’t a strong yes, it didn’t ship.
This ruthless framework saved us from countless half-baked AI integrations that would have been shiny demos but terrible products.
Lessons Learned: The Greatest Hits
1. Data Mapping is Everyone’s Nightmare

Every company organizes data differently. Building flexible mapping that could handle this variation without requiring a data engineer to configure it was our white whale.
What worked:
Smart field detection using AI
Learning from user corrections
Pre-built templates for common systems (SAP, NetSuite, QuickBooks)
Visual mapping interface (drag-and-drop saved us)
We caught it eventually, but it took three attempts and a lot of user testing.
2. Excel is King (Sorry, Not Sorry)
We built beautiful bulk import UIs with progressive disclosure, smart validation, and real-time feedback.
Users still wanted Excel templates.
The pivot: We embraced it. Built robust Excel-based data models with:
Pre-populated dropdown menus
Conditional formatting for errors
Embedded documentation
Macro-enabled validation
And honestly? It was the right call. Fight your users’ workflows at your expense.
3. Analytics Drive Decisions (Not Just Compliance)
Companies don’t just want numbers – they want insights.
What transformed our calculator from a compliance tool to a strategic platform:
Emission trend analysis over time
Hotspot identification (top 10 contributors)
Scenario modeling (”What if we switch to renewable energy?”)
Peer benchmarking
Reduction pathway visualization
The analytics layer was the difference between a calculator and a decision-making platform.
But here’s where it got complex: We wanted to build dashboards that could slice emissions data across multiple dimensions:
By department (Who’s the biggest emitter: Operations or Sales?)
By location (Which office/facility needs attention?)
By product (Product-level carbon footprinting)
By employee (Yes, even at the individual level for business travel)
The challenge? Mapping data points and KPIs to these multi-dimensional views was like solving a Rubik’s cube blindfolded.
Why it was hard:
Companies structure their data differently (cost centers vs. departments vs. business units)
One transaction could belong to multiple categories (a product manufactured at Location A, sold by Department B, shipped to Location C)
Employees move departments, locations change names, products get rebranded
The same KPI needed different calculation logic depending on the view
We ended up building a flexible dimensional model that let users define their own hierarchies and mappings. It wasn’t the fastest solution, but it was the only one that worked across different organizational structures.
4. AI Feature Prioritization is an Art, Not a Science
Our prioritization framework evolved into:
High-value AI features (shipped first):
Document OCR and parsing
Automated factor mapping
Data quality scoring
Anomaly detection
Medium-value AI features (shipped later):
Predictive modeling
Reduction recommendations
Supplier risk scoring
Low-value AI features (never shipped):
Generic chatbots
Over-automated workflows that removed user control
“AI-powered” features that were just if-then logic
5. Compliance + User Experience is Actually Possible
We proved you could build a tool that was both:
Technically rigorous (auditable calculations, transparent methodologies, standards-compliant)
Actually pleasant to use (intuitive interface, minimal clicks, clear feedback)
It just required obsessive attention to both. No compromises.
6. Build for Iteration (Future-You Will Thank You)
Our architecture assumed we’d need to:
Swap emission factors regularly
Update calculation methodologies
Adjust to new standards
Support regional variations
Add new emission categories
This foresight saved us when:
Regional regulations changed (looking at you, CSRD)
New scope 3 categories became material
Customers needed custom factor libraries
7. The “Excel Problem” Became Our Superpower
Instead of fighting the fact that sustainability teams lived in Excel, we became the best Excel-to-insights tool in the market.
What this looked like:
Excel templates that were actually well-designed
Bulk upload that handled 50,000+ rows
Export functionality that matched import format
Formulas users could audit and understand
The Conclusion: It’s Never Really Done
Building the Carbon Emissions Calculator taught me that ESG products exist at this fascinating intersection of regulatory compliance, environmental science, enterprise software, and change management.
You’re not just building a tool: you’re building something that helps companies understand and reduce their emissions.
No pressure.
Would I do it again?
Absolutely.
Would I do it differently?
You bet.
That’s the beauty of product development: every shipped feature is just version 1.0 of the lesson you’re about to learn.
Got questions about building ESG products or want to share your own carbon calculator war stories? Drop a comment below or reach out. I promise I’ve made enough mistakes for both of us.
If you found this helpful, subscribe for more ESG product lessons – I’m just getting started.
About Me
Hey! I’m Ekta, your Product Manager next door - bringing ideas to life! I am very very glad you are here! Welcome to my little world of everything product.
I am a seasoned product manager with a knack for problem-solving and analytical skills. I am passionate about building products from 0 to 1! I have a strong ability to translate complex requirements into products!
Three words that describe me: Problem Solver (Always one problem at a time), Meticulous (A little lesser than OCD), Adaptable (RMG? Climate-tech? Name an industry I can create stellar product solutions end-to-end).
Subscribe to follow my blog
Weekly posts on building AI-powered products, product management in sustainability & other industries, and lessons from shipping real tools.
P.S. If you found this useful, three ways to support this blog:
Share it with someone building or using complex products
Comment with your biggest product challenge
Subscribe to get the next post in your inbox
Let’s make products that don’t suck!